

How to Draw an Excel Table for AI
Why spreadsheets built for humans confuse machines — and how to make your data machine-readable

For decades, the spreadsheet — or its programmatic cousin, the data frame — has been the universal medium of analysis. But that world has changed.
Today, most tables are no longer consumed by humans.
They are consumed by machines: APIs, data pipelines, LLM agents, validation systems, and reasoning engines that need to know what the numbers mean, not just how they are arranged.
And yet our tools — and our habits — haven’t caught up.
Whether you work in Excel, Python, R, SQL, PowerBI, or OpenOffice, the systems you use can calculate regressions, visualise trends, and clean data brilliantly.
But they cannot, on their own, tell another system:
“this column is GDP, measured in millions of euros”,
“this code ‘1’ means wholesale, and ‘2’ means retail”,
“this timestamp is in UTC”,
“this variable follows an official statistical concept defined by Eurostat”.
Without this semantic layer, AI systems cannot reason across datasets — they can only guess. This is one reason LLMs hallucinate: most data tables carry values, not meaning.
To build data that is future-proof and AI-ready, we need to rethink the table itself. We implemented a solution to this problem in the R statistical environment and language, but our approach works in PowerBI or Python, too.
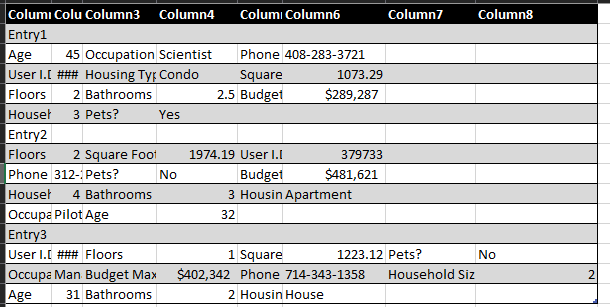
Why Spreadsheets Fail AI
A spreadsheet or tidy data frame is easy for a human: rows, columns, headers.
But trained (and expensive) data scientists typically spend hours — sometimes days — trying to transform a human-friendly spreadsheet into something machines can interpret.
For AI, that structure is meaningless unless it also knows:
what each variable represents,
the units of measurement,
the ontology or vocabulary it belongs to,
when and how it was created.
Most tabular data is a cognitive artefact — built for human readability, not machine understanding. As we move toward autonomous agents and LLM-integrated pipelines, this becomes a critical bottleneck.
The solution: a table must become a semantic contract.
Rethinking the Table
In modern data governance, a dataset is not just a table. It is a described object: it has meaning, provenance, units, definitions, contributors, and context that must travel with the data itself.
International standards such as ISO/IEC 20546, Dublin Core, and the W3C Data Cube Vocabulary all define a dataset not as a file, but as a semantically described resource. Traditional tables — whether in Excel, CSV, pandas, R data.frames, or SQL exports — don’t contain any of this information. They are brilliant containers for numbers and strings, but they are not designed for semantics.
That is why we developed a software library for R, but the principles behind it apply everywhere: attach meaning at the moment of dataset creation, not afterwards.
From Values to Meaning
Keep reading with a 7-day free trial
Subscribe to Connect to the AI Grid to keep reading this post and get 7 days of free access to the full post archives.